The first month of Copilot Cowork is a baseline, not a verdict.
For Microsoft’s qualifying Frontier grace-period cohort—and for the tenant in this guide—July was the first full billed calendar month of Copilot Cowork consumption.
But opening one dashboard, copying the big number, and calling it “usage” will give you an incomplete story.
There are really two questions:
- What did Cowork consume?
- Are people adopting it in a healthy, valuable way?
Microsoft answers those questions in two different areas of the Microsoft 365 admin center. The Cost Management report shows Copilot Credit consumption. The Cowork Usage report shows adoption, tasks, activity, and retention.
They use different definitions, date controls, and refresh cycles.
This guide walks through both, shows what I found in a real first-month tenant, and gives admins a practical checklist for configuring and reviewing month one.
Still setting up the billing side? Start with Copilot Cowork billing and spending controls, then return here for the July consumption and adoption case study.
Important July context: Copilot Cowork became generally available on June 16, 2026. Tenants with at least one user who used Cowork during the Frontier period from March 30 through June 16 received a billing grace period through June 30, with billing beginning July 1. That makes July the first full billed month for that cohort—not automatically for every tenant. Confirm your own activation and billing dates before labeling July “month one.”
In this guide
- The two dashboards answer different questions
- How to check July Copilot Cowork consumption
- What the first full month looked like in this tenant
- Now check adoption—but label the date range honestly
- The first-month admin playbook
- The metrics I would put on an admin scorecard
- Month-one red flags worth investigating
- What I would change for month two
- Final thought
- Sources
The two dashboards answer different questions
| Admin view | Best for | Date behavior | Refresh behavior |
|---|---|---|---|
| Copilot > Cost Management | Credits, limits, policies, users, groups, agents/services, prepaid versus PayGo | Supports an exact month such as July 2026 | Overview refreshes every 4 hours; Consumption refreshes every 2 hours |
| Copilot > Cowork > Usage | Active users, tasks, scheduled versus user-initiated work, retention, adoption trends | Rolling 7, 28, 90, or 180 days; default is 28 days | Check the report’s visible Last updated timestamp |
That distinction matters. The Cowork Usage report I reviewed on August 5 offered a 28-day range of July 5 through August 2. It did not offer a calendar-month July option. I could use it to understand adoption near the end of July, but I could not honestly present it as an exact July report.

How to check July Copilot Cowork consumption
1. Start in Cost Management, not the generic Copilot credits report
In the Microsoft 365 admin center, go to:
Copilot > Cost Management > Consumption
For Cowork, this is the useful consumption surface. It lets you move between Users, Groups, and Agents and services.
Do not confuse it with Reports > Usage > Microsoft 365 Copilot > Credits. That report has a different scope and is not the report I would use to isolate Cowork consumption.
2. Select July 2026
Open Time period and select July 2026.

Here is the small trap I saw in the August 5 tenant UI: changing between Users, Groups, and Agents and services reset the time period to Month to date. Re-select July on every view and confirm the label before recording a number or exporting data.
3. Use Agents and services to isolate Cowork
Start with Agents and services. This is the cleanest way to separate Cowork from Work IQ API or another consumptive service covered by the same policy.

Record at least:
- Cowork Credits used
- Active users
- Sessions
- The report period
- The time and date you captured the report
That last item is not busywork. Microsoft says the Consumption tab refreshes every two hours, while exported reports are point-in-time snapshots. A dashboard and an export taken at different moments can temporarily disagree.
4. Review users for concentration and limit pressure
Move to Users, re-select July, then inspect:
- Credits used
- Monthly credit limit
- Percentage of the limit consumed
- Sessions
- Last activity date
- Assigned spending policy
- Daily credit usage


Do not just chase the largest user. Ask whether the work was intentional, repeatable, and valuable. A heavy user may be delivering the best ROI in the tenant. The useful signal is high consumption without an understood scenario, owner, or outcome.
5. Review groups, then re-check the period
The Groups view helps you compare the audiences targeted by spending policies. It is useful for spotting:
- One group consuming most of the credits
- A group with low consumption after you compare the Consumption view with its enabled scope under Configuration
- A pilot team whose limits are too low for its intended workload
- Overlapping memberships that make policy behavior harder to explain

User and group totals do not always match perfectly. Users can belong to multiple groups and policies, and policy changes during a billing period can affect what appears at user level. Treat these views as different analytical cuts, then reconcile material differences against exports and policy history.
6. Check the July spending trend separately
Return to Cost Management > Overview and set the Spending trend card to July.

Look for:
- Large daily spikes
- A steady upward ramp after enablement
- Weekend spikes to compare with scheduled-task history
- A shift from prepaid capacity into PayGo
- A sudden drop that coincides with a limit or access change
In the tenant reviewed for this guide, July was spiky rather than smooth. The largest single day used more than 12,000 credits, while several days were below 1,000. That is a prompt to investigate which scenarios or scheduled tasks ran on the high days—not proof that the spikes were waste.
What the first full month looked like in this tenant
The following numbers are an anonymized, point-in-time snapshot captured on August 5, 2026.
Exact July consumption
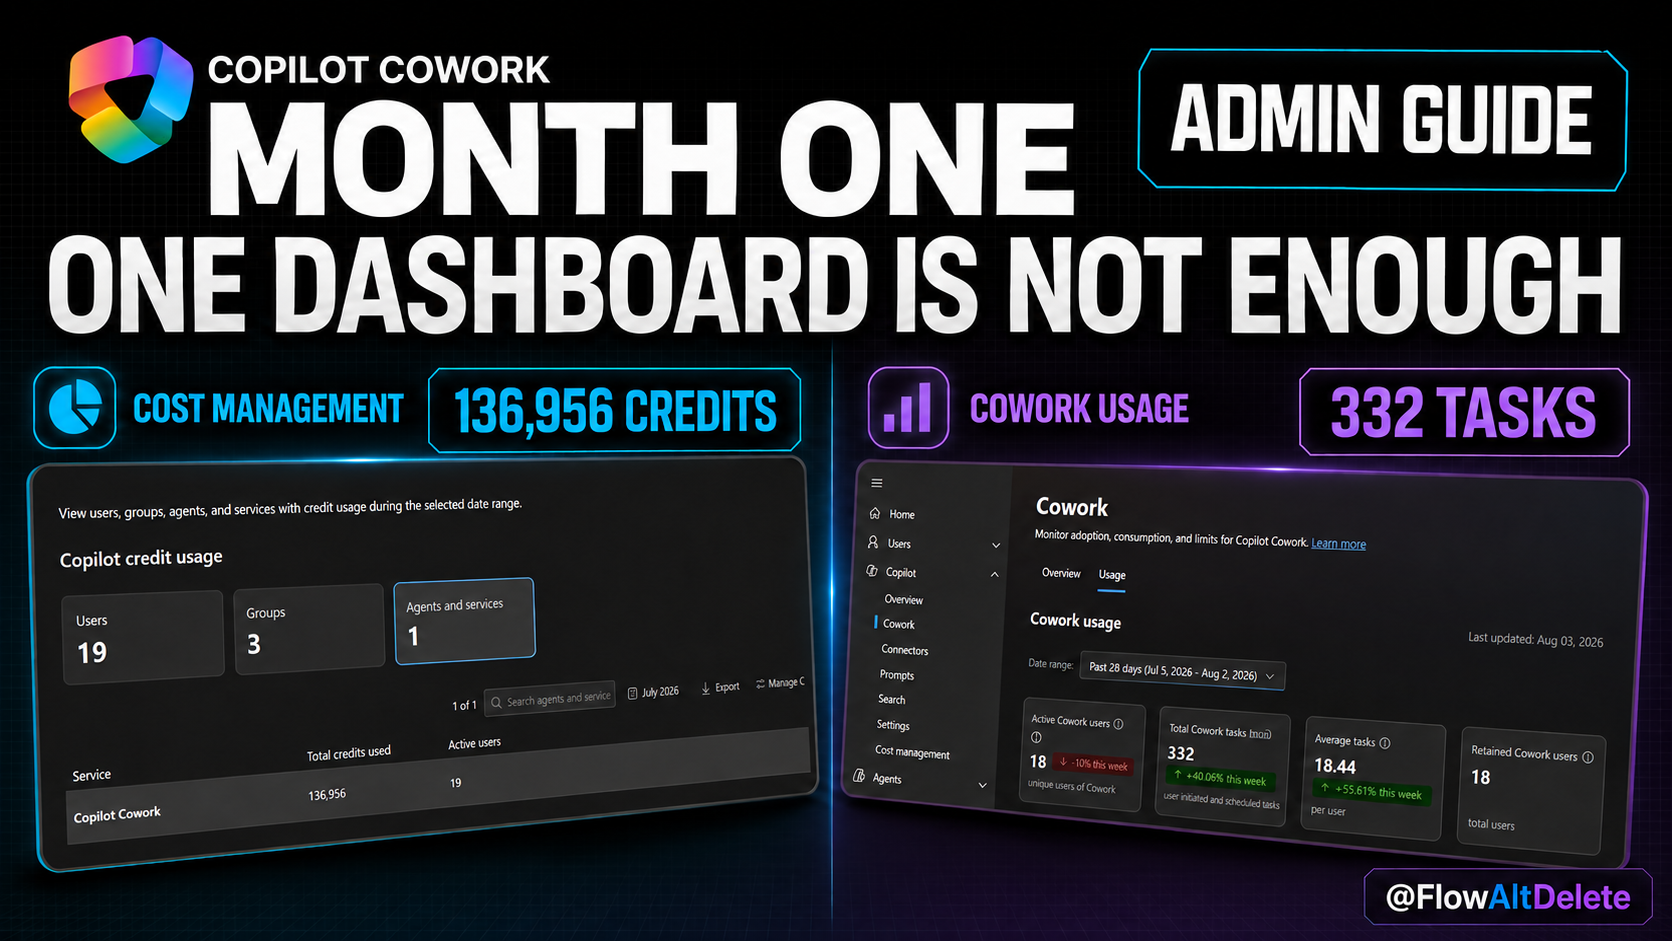
- 136,956 Cowork Credits in the Agents and services view
- 19 active Cowork users in that service view
- 260 sessions across the user rows
- 18 users with non-zero recorded credits at capture time
- 6,150 median credits across the 19 user rows
- 7,208 average credits across the 19 user rows
- 526.7 credits per session across the user rows
- The largest user represented 22.0% of user-level credits
- The top five users represented 59.8% of user-level credits
- 6 users had consumed at least half of their individual limit
- 0 users had consumed 80% or more of their individual limit
The service, group, user, and trend views differed by a few hundred credits at capture time: roughly two-tenths of one percent. That is small enough to be consistent with refresh timing and aggregation differences, but it should still be documented. Use one defined source for the headline number—here, the Cowork row under Agents and services—and preserve exports when you close the month.
Do not turn credits directly into an invoice unless you know the billing path
Microsoft lists PayGo at $0.01 USD per Copilot Credit. At pure retail PayGo, 136,956 credits would be a $1,369.56 USD usage equivalent.
That is not automatically the tenant’s invoice. This tenant’s policies used prepaid capacity. When capacity packs and a subscription with P3/pay-as-you-go are both selected, Microsoft documents the order as capacity packs first, then P3 prepaid credits, then PayGo. Discounts, prepaid commitments, shared capacity, and billing arrangements can all change the actual cost. Report credits and billing source together.
Now check adoption—but label the date range honestly
Go to:
Copilot > Cowork > Usage

The report’s four headline metrics are:
- Active Cowork users
- Total Cowork tasks
- Average tasks per active user
- Retained Cowork users

Microsoft defines a task as one Cowork conversation thread, including user-initiated conversations and scheduled task executions. Follow-up questions in the same thread remain part of the same task.
The same report defines a retained user as someone active in both the previous seven-day period and the most recent seven-day period. It is a useful continuity signal, but it is not a conventional month-over-month cohort retention rate.

The report was viewed on August 5 and displayed Last updated: August 3. For the rolling 28 days from July 5 through August 2, this tenant showed:
- 18 active users
- 332 total tasks
- 18.44 average tasks per active user
- 18 retained users
- 103 user-initiated tasks
- 229 scheduled tasks
That means about 69% of tasks were scheduled. It is a valuable operational signal: Cowork was being used as automation, not only as a conversational tool.


But the average hid a highly concentrated pattern: one user accounted for 206 of the 332 tasks, or about 62%. The median active user had only 6 tasks. Fifteen users were active on two days or fewer.
This does not mean the rollout failed. It means the first-month story is a scheduled-heavy tenant and a highly concentrated user-level pattern, plus a low-frequency long tail. Month two should validate the dominant user’s scenarios while improving repeat, intentional use across the rest of the pilot.
The first-month admin playbook
Days 1–3: Prove the plumbing
- Confirm each intended user has a Microsoft 365 Copilot license.
- Confirm usage-based billing is enabled and tied to the correct subscription or prepaid capacity.
- Confirm Cowork is discoverable to the intended audience.
- Confirm the intended security groups are assigned to an active spending policy.
- Run a controlled task and verify it appears after each report updates. Use the visible Last updated timestamp for Cowork Usage and allow for Cost Management’s documented refresh window.
- Capture the initial policy, billing method, and access configuration before changing anything.
Discoverability and access are separate controls. The discovery setting controls tenant-wide visibility, while Cost Management controls scoped access and spend. Microsoft says usage-based billing setup overrides the discovery setting for users covered by that setup, so validate both the tenant-wide experience and the intended scoped audience.
Week 1: Establish safe limits and alerts
Start with group-based policies that match the rollout audiences. A practical pilot configuration should include:
- A policy-level monthly cap
- A per-user monthly cap
- Alerts well before the hard cap
- Named operational and financial owners for those alerts
- Explicit agents and services included in the policy
- A documented billing method
Also make an explicit decision about Allow new services and agents as they become available. Microsoft’s current policy setup selects that option by default. That can be convenient, but a controlled pilot should not inherit future service access without an owner and review process.
Spending policies impose access and consumption limits; they do not reserve or allocate a slice of the underlying Copilot Credit capacity to a group. Treat policy limits as guardrails, not as capacity reservations.

Microsoft’s current precedence order for overlapping policies is:
- Highest per-user limit
- If tied, highest overall policy limit
- If still tied, newest policy
That is easy to get wrong. Adding a “special” policy can accidentally make someone less restricted than intended.


When the run rate is unknown, I start the first alert at 50%. Once you understand the run rate, use multiple operational checkpoints outside the platform—such as weekly reviews at 50%, 70%, and 85%—even if the product sends a single configured alert threshold.
Use least privilege for the operating team. AI Administrators and License Administrators can create spending policies, manage limits and alerts, and view Cost Management. Selecting or overriding the billing method requires a Global Administrator or Billing Administrator. After a spending policy is created, its billing method cannot be changed; Microsoft requires deleting and recreating that policy.
Week 2: Review adoption, not just activation
Ask five questions:
- How many targeted users became active through a direct prompt or a scheduled execution?
- How many came back in the next seven-day period?
- Is work primarily user-initiated or scheduled?
- Is usage concentrated in one person, team, or scenario?
- Which enabled users have no visible activity and need a use case, training, or removal from the pilot?
The Usage table lists people with Cowork activity dating back to April 1, 2026, while its summary cards respond to the selected rolling period. Do not use the total table row count as your active-user count. Also remember that an active user can be counted because they prompted Cowork or because a scheduled task executed on their behalf. Active-user coverage is not identical to direct human adoption.
Week 3: Connect consumption to scenarios
For the top users and largest days, document:
- Business scenario
- Owner
- Frequency
- User-initiated or scheduled
- Inputs and data sources
- Outputs and downstream actions
- Credits consumed
- Time saved or risk reduced
- Whether a lower-cost model or tighter scope can produce an acceptable result
Consumption alone is not value. A 5,000-credit task that replaces two days of expert work may be excellent. A 500-credit task running every hour with nobody reading the output may not be.
Week 4: Freeze the baseline and decide month two
- Re-select the exact July period in every Cost Management view.
- Export users, groups, and agents/services after the reporting refresh.
- Record the Cowork Usage rolling range and Last updated timestamp.
- Preserve policy settings and group membership as of month-end.
- Explain material differences between views.
- Review users near limits and compare the configured audience with users showing no repeat activity.
- Classify scheduled tasks as keep, tune, pause, or investigate.
- Set month-two targets before raising budgets.
The metrics I would put on an admin scorecard
| Metric | Formula | What it tells you |
|---|---|---|
| Active coverage | Active users ÷ enabled target users | How much of the intended audience generated direct or scheduled activity |
| Retained-to-active ratio | Retained users ÷ active users | A simple continuity signal, not a conventional cohort-retention rate; retained users compare the two most recent seven-day periods while active users cover the selected range |
| Scheduled-task share | Scheduled tasks ÷ total tasks | How much usage is recurring automation versus direct interaction |
| Credits per active user | Cowork credits ÷ active users | Overall consumption intensity when the periods align |
| Credits per session | Cowork credits ÷ Cost Management sessions | Relative session intensity within the consumption report |
| Limit utilization | Credits used ÷ applicable policy limit | How close a user or policy is to its cap; the limit does not reserve underlying capacity |
| Top-five concentration | Credits from top five users ÷ total user credits | Whether the rollout depends on a few users |
| Average-to-median gap | Average usage compared with median usage | Whether a small number of heavy users are distorting the average |
Only combine figures whose date ranges and definitions match. A Cowork task is not a Cost Management session. In this review, the adoption report covered July 5 through August 2 while the consumption report covered July 1 through July 31, so I did not calculate credits per task.
Month-one red flags worth investigating
- A view silently returned to Month to date after you changed tabs.
- The Overview headline cards and Spending trend chart are showing different periods.
- A user or group is above 80% of its cap with time left in the month.
- Scheduled work dominates consumption but has no named owner or reviewed output.
- Average usage is high while median usage is low.
- A service other than Cowork is consuming credits under the same policy.
- A group has access but almost no activity.
- A spending policy includes new services automatically without a review process.
- Several groups overlap, producing a more permissive policy than expected.
- Finance is treating credits multiplied by retail PayGo as the invoice even though prepaid capacity or P3 applies.
- Security assumes all Microsoft Purview controls apply identically to Cowork. As of this writing, Microsoft documents DLP for general Cowork AI interactions as unsupported, even though auditing, sensitivity labels, eDiscovery, data lifecycle, communication compliance, and other controls have documented support. Cowork’s local Edge browser tasks are narrower: Microsoft says they inherit existing browser DLP, Conditional Access, and site policies. Review both control paths rather than inheriting assumptions from another Copilot surface.
What I would change for month two
For this tenant, I would not start by cutting the heavy user or scheduled workload. I would first confirm whether that automation is producing a real business outcome. If it is, preserve it and establish an owner, expected run rate, and value measure.
Then I would:
- Create a repeat-use goal for the low-activity users.
- Review the five largest credit consumers and the largest daily spikes.
- Audit scheduled tasks for frequency, duplicate runs, and unused output.
- Separate Cowork and Work IQ API policy reporting wherever the rollout design allows it.
- Keep alerts early enough to react before a hard cap blocks work.
- Raise limits only for a documented scenario with evidence of value.
- Review plugins, model availability, browser use, audit coverage, and Purview support as part of the same operating rhythm—not as a one-time launch checklist.
Final thought
The goal of month one is not to prove that every user became a power user. It is to leave with a trustworthy baseline: who used Cowork, what they ran, what it consumed, which work repeated, and which controls need to change next.
That is the admin story July can tell—if you use both dashboards and keep their definitions straight.
Leave a Reply